Introduction
When was the last time you deleted a node_modules folder from a project you finished six months ago? Probably never, because you forgot it existed. Multiply that by every JS/TS project on your machine, add in .next caches, dist outputs, coverage reports, and .turbo caches, and you're looking at tens of gigabytes of dead weight.
We built dustoff, a CLI that finds all 30+ types of these artifacts and lets you interactively browse, select, and delete them.
Here's how we built it: the stack choices, the algorithms, and the problems that looked simple until they weren't.
Why TypeScript and React for a CLI Tool
The instinct for CLI tools is to reach for Go or Rust. Fast binaries, no runtime dependency. We went the other direction: TypeScript, React (via Ink), and Bun for tooling.
Why? Anyone who has node_modules on their machine already has Node.js. That means npx dustoff just works, no install step. And building on Ink (React for terminals) let us iterate significantly faster than we could have with raw ANSI codes or BubbleTea.
The trade-off: startup time is ~200ms instead of ~10ms. For an interactive tool you run once every few weeks, this is invisible. For a tool you'd pipe into scripts, it would matter. Know your use case.
The Scanner: BFS, Not DFS
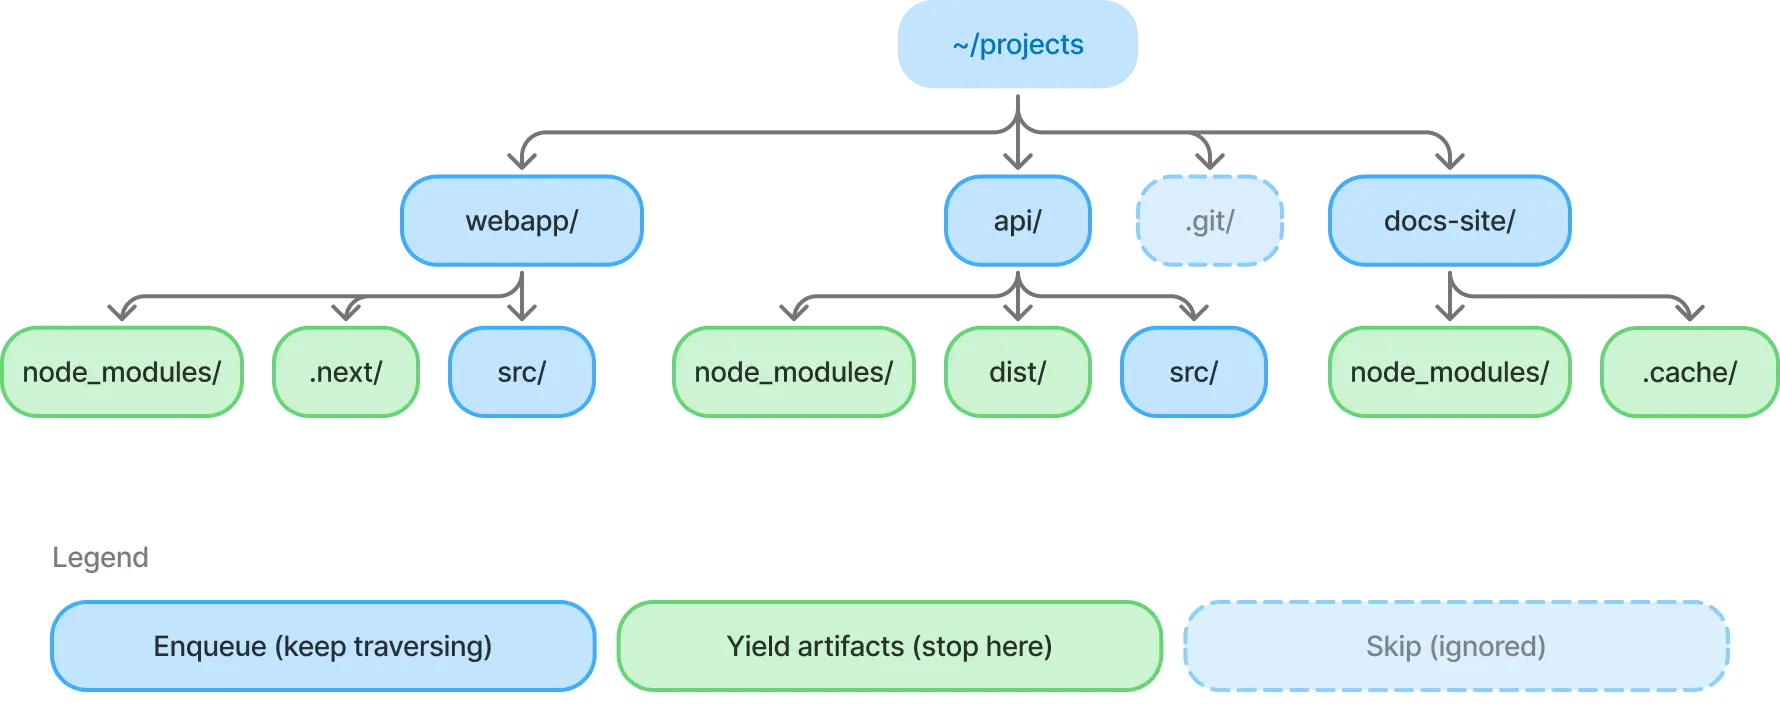
The core algorithm is a breadth-first filesystem walk. BFS was a deliberate choice over DFS for two reasons:
- Artifacts cluster at shallow depths.
node_modulessits at depth 1 or 2 in most projects. BFS finds them faster. - Natural abort boundary. When we find a target directory (
node_modules,.next,dist, etc.), we yield it and don't recurse into it. This is the key insight. You don't want to count files insidenode_modulesduring the scan phase; you want to find it and move on.
The scanner is an AsyncGenerator. It yields artifacts as they're found and streams them to the UI in real-time. No waiting for a full scan to complete.
async function* scan(root: string): AsyncGenerator<ScanResult> {
  const queue = [root];

  while (queue.length > 0) {
    const dir = await opendir(queue.shift()!);

    for await (const entry of dir) {
      if (entry.isSymbolicLink()) continue;
      if (!entry.isDirectory()) continue;

      const path = join(dir.path, entry.name);

      // .git, .vscode -> skip entirely
      if (IGNORE_DIRS.has(entry.name)) continue;

      // artifact found -> yield it, don't recurse
      if (TARGET_DIRS.has(entry.name)) {
        yield { path, type: entry.name };
        continue;
      }

      queue.push(path); // regular dir -> keep traversing
    }
  }
}
Size calculation happens asynchronously after discovery: the UI shows "sizing 14/47" as each artifact's disk usage is computed in the background.
Gotcha we hit: isSymbolicLink() must be checked before isDirectory(). A symlink to a directory returns true for both. Following symlinks during a scan causes infinite loops or double-counting.
Getting Size Right Is Harder Than You Think
Reporting accurate disk usage is the most deceptively complex part of the tool. Here's what we handle:
Block-based accounting. stat.size reports logical file size. stat.blocks * 512 reports actual disk allocation. A 1-byte file consumes 4KB on disk. We use blocks when available, falling back to size on Windows and in tests (memfs doesn't populate blocks).
Hardlink deduplication. Package managers like pnpm and Bun use hardlinks aggressively. A single file can appear in dozens of node_modules directories but consume disk space only once. We track dev:ino pairs in a Set to count each inode only once:
const inodeKey = `${s.dev}:${s.ino}`;
if (seenInodes.has(inodeKey)) continue;
seenInodes.add(inodeKey);
Without this, a pnpm monorepo would report 10x its actual disk usage. We wrote integration tests with real hardlinks on disk to verify this behavior. It's too important to trust to mocked filesystems alone.
Timeout protection. Some node_modules directories contain 200k+ files and take unreasonably long to size. We wrap the calculation with Promise.race against a timeout, using a Symbol sentinel to distinguish "timed out" from "legitimately 0 bytes":
const TIMEOUT = Symbol('timeout');
const result = await Promise.race([
  calculateSize(dirPath),
  delay(timeoutMs, TIMEOUT),
]);
if (result === TIMEOUT) return null; // "size unknown"
Virtual Scrolling in 24 Rows
Terminals aren't browsers. There's no overflow-y. A typical scan finds hundreds of artifacts, and you have ~24 rows to show them. We built a useWindow hook that computes a viewport slice:
const scrollOffset = Math.max(0,
  Math.min(
    cursorIndex - Math.floor(visibleCount / 2),
    Math.max(0, items.length - visibleCount),
  ),
);
return items.slice(scrollOffset, scrollOffset + visibleCount);
The cursor stays centered in the viewport. Only visible rows are rendered. Every row component is React.memo-wrapped to skip re-renders on parent state changes. Terminal frame rates are unforgiving.
For data density, we use Unicode braille characters (⣿) as size bars: 8 characters wide, colored by size threshold (yellow < 100MB, orange < 1GB, red >= 1GB). It's a tiny detail that makes scanning the table faster than reading numbers.
Preventing Terminal Flicker
The most obscure bug we fixed: on fast re-renders, the terminal would tear. Half the old frame visible alongside half the new one. The fix is DECSM 2026, a synchronized output protocol:
process.stdout.write = ((chunk: string, ...args) => {
  return originalWrite('\x1b[?2026h' + chunk + '\x1b[?2026l', ...args);
}) as typeof process.stdout.write;
The terminal buffers all writes between the start/end markers and paints them atomically. iTerm2, Kitty, WezTerm, and foot all support it. Terminals that don't simply ignore the sequences.
If you're building a TUI that re-renders frequently, this is a must-have.
Testing a Terminal App
Our testing strategy has three layers:
- Reducer tests (fast, pure): call
reducer(state, action)directly. Test every state transition without rendering. This is where 80% of bug-catching happens. - Component tests (medium):
ink-testing-libraryrenders components to a string. Check that the right text appears with the right formatting. - Integration tests (slow, real FS): real filesystem operations for things that can't be mocked accurately (hardlink inode deduplication). These use a
.integration.test.tssuffix and are excluded from CI's fast path.
Unit tests use memfs for filesystem mocking. Safe, fast, and reproducible. But we learned the hard way that memfs doesn't populate stat.blocks, which masked a bug in our size calculation. The integration test layer exists because of that specific failure.
What We'd Build Differently
Start with useReducer from day one. We began with scattered useState calls and migrated to a centralized reducer halfway through. Every feature added before that migration (cursor, selection, sorting) was increasingly painful to wire together. In a keyboard-driven TUI, centralized state management isn't a nice-to-have. It's foundational.
Invest in component tests earlier. We leaned on reducer tests (fast, reliable) and added ink-testing-library rendering tests later. The reducer tests caught logic bugs, but missed layout regressions: a column shifting by one character, a status bar disappearing on resize. Both layers matter.
Stream results from the start. Our first version collected all artifacts before rendering anything. The scan was fast, but staring at a blank screen for 5 seconds felt slow. Switching to an AsyncGenerator that yields results as they're found changed the entire perception of speed. Same scan time, completely different experience. We should have designed for streaming from day one instead of retrofitting it.
Try It
npx dustoff